Understanding the Nifty 50 Chart and Its Implications
Introduction to Nifty 50 Chart
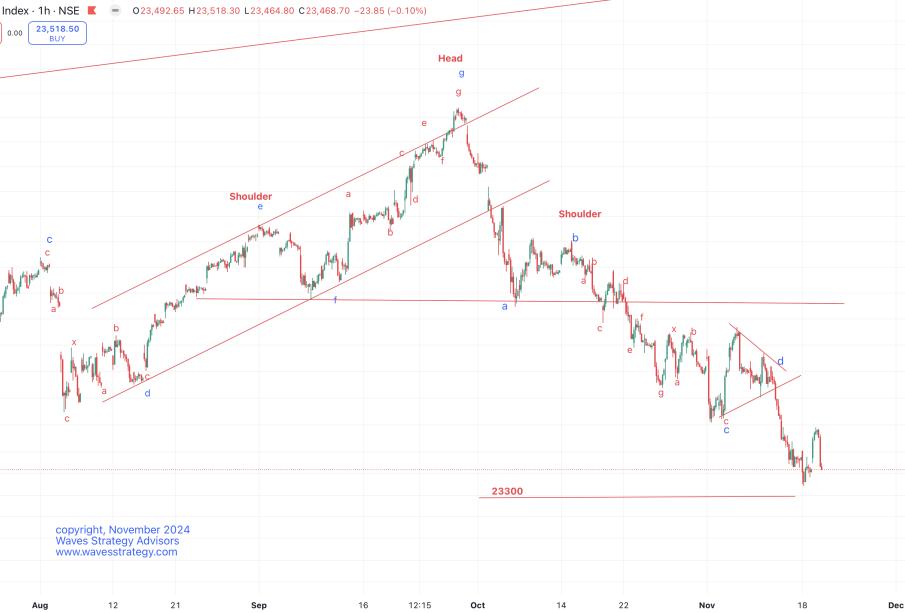
The Nifty 50 chart is a crucial tool for investors in the Indian stock market, representing the performance of the National Stock Exchange’s 50 most populous stocks. This index acts as a barometer for the Indian economy and provides insights into market trends, making it essential for traders and investors alike to track the Nifty 50 chart regularly.
Current Trends and Events
As of mid-October 2023, the Nifty 50 index has shown a notable upward trend, reaching approximately 19,500 points. Experts attribute this growth to several factors including strong corporate earnings, conducive global financial conditions, and a rebound in domestic consumption following the pandemic. Investors are keenly observing the chart for any signs of resistance levels, especially as it nears historical highs.
Recent reports suggest that sectors such as Information Technology and Financials are driving this growth. Notably, stocks like Infosys and HDFC Bank have played pivotal roles in lifting the index. Investors have responded positively, leading to increased trading volumes as they capitalize on opportunities presented by the current bullish trend.
Technical Analysis of the Chart
Analysts often employ technical indicators when interpreting the Nifty 50 chart. With the recent highs, tools like Moving Averages and Relative Strength Index (RSI) are being utilized to assess market momentum. The 200-day moving average is currently a point of interest, as it serves as a long-term trend indicator for many investors. The RSI suggests that the index is nearing overbought territory, which could hint at potential market corrections.
Conclusion and Future Outlook
The Nifty 50 chart serves as a vital piece of information for anyone engaged in the stock market. Its current performance indicates a robust bullish phase but also warns investors of potential volatility ahead. As the fiscal year progresses, market participants will continue to monitor economic indicators and corporate earnings reports closely to gauge future trends.
In conclusion, understanding the nuances of the Nifty 50 chart will be key for investors looking to make informed decisions in the dynamic landscape of the Indian stock market. Keeping abreast of trends and analyses will not only aid in timing investments correctly but also in managing risks effectively.