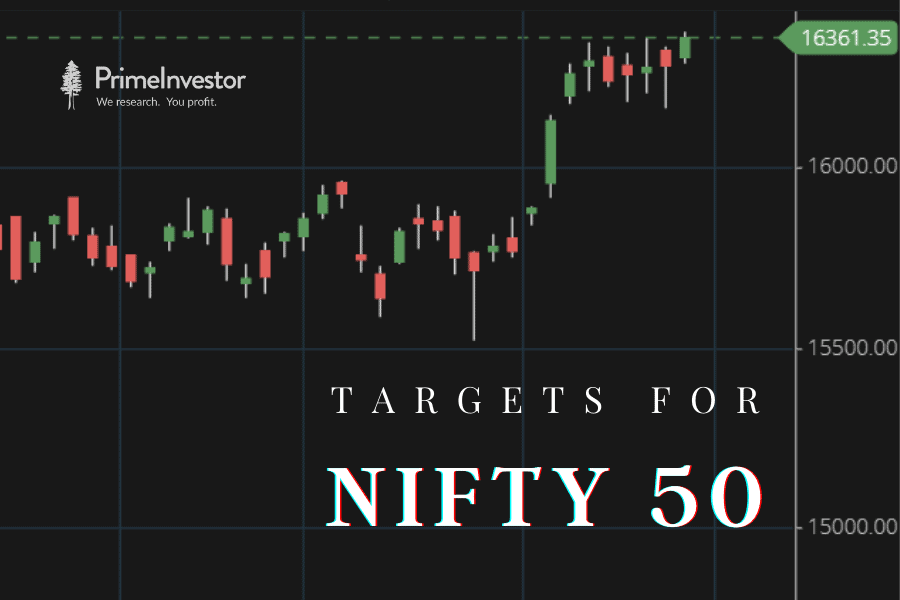
Understanding the Nifty 50 Chart: Analysis and Trends

Introduction to Nifty 50
The Nifty 50 index is a key benchmark for the Indian equity market, comprising 50 of the largest and most liquid stocks listed on the National Stock Exchange (NSE). Tracking the Nifty 50 chart is crucial for investors as it provides insights into market trends, investors’ sentiment, and overall economic health. As India experiences economic fluctuations and global market interactions, understanding the Nifty 50 chart becomes increasingly relevant for making informed investment decisions.
Current Trends in the Nifty 50 Chart
As of October 2023, the Nifty 50 index has shown a consistent upward trend, recovering from the volatility experienced earlier in the year. Recent data suggests that the index has touched new highs, supported by robust corporate earnings and a positive economic outlook. The current level hovers around 20,000 points, a significant psychological level. The trading volume has also increased, indicating strong investor interest.
Analysts attribute this growth to various factors, including strong performance from sectors such as information technology, pharmaceuticals, and renewable energy. According to market analysts, the support level for the Nifty 50 is identified at around 19,500 points, which could act as a buffer against potential downturns.
Technical Analysis and Predictions
Technical Indicators from the Nifty 50 chart suggest a bullish trend in the medium term. The Relative Strength Index (RSI) and Moving Averages indicate that the current market conditions favor upward momentum. Investors are encouraged to keep an eye on upcoming earnings reports and global economic cues that could affect market sentiment.
Many analysts predict that if the Nifty 50 sustains above the 20,000 mark, it could pave the way for further gains, potentially reaching levels around 21,000 in the upcoming months. However, caution is advised as market corrections are common and should be expected.
Conclusion
The Nifty 50 chart serves as a vital tool for investors looking to navigate the complexities of the Indian stock market. Its significance in reflecting market conditions cannot be overstated. Investors should continue to monitor the trends, technical indicators, and economic signals that could impact future performance. By doing so, they can make strategic choices in their investment portfolios, ultimately leading to informed financial decisions.


